Foood Space
Using open data to identify the drivers of success for New York City restaurants
Insights for restaurateurs
Opening a restaurant in NYC requires making choices that directly impact the chances of success. In the course of pinning down a cuisine, location, or menu price, you might ask:
- Just how valuable are star ratings?
- What price level is best for my establishment?
- Am I better off on an avenue or a street?
A data science approach can help predict how these choices could impact your business.
Restaurant revenue model View code »
We use restaurant features—including average rating, cuisines served, latitude, longitude, menu price, and opening hours—to predict a restaurant's revenues. To develop a proxy for revenues, we multiply (1) the number of reviews a restaurant has received by (2) the average price of a meal at that restaurant.
The model takes an ensemble learning approach by first fitting linear relationships using ridge regression and then modeling the residuals using a random forest. We use five-fold cross-validation to tune the ensemble model hyperparameters to ridge \(\alpha\) of 0.037, a forest of 200 decision trees, and 20 features per tree.
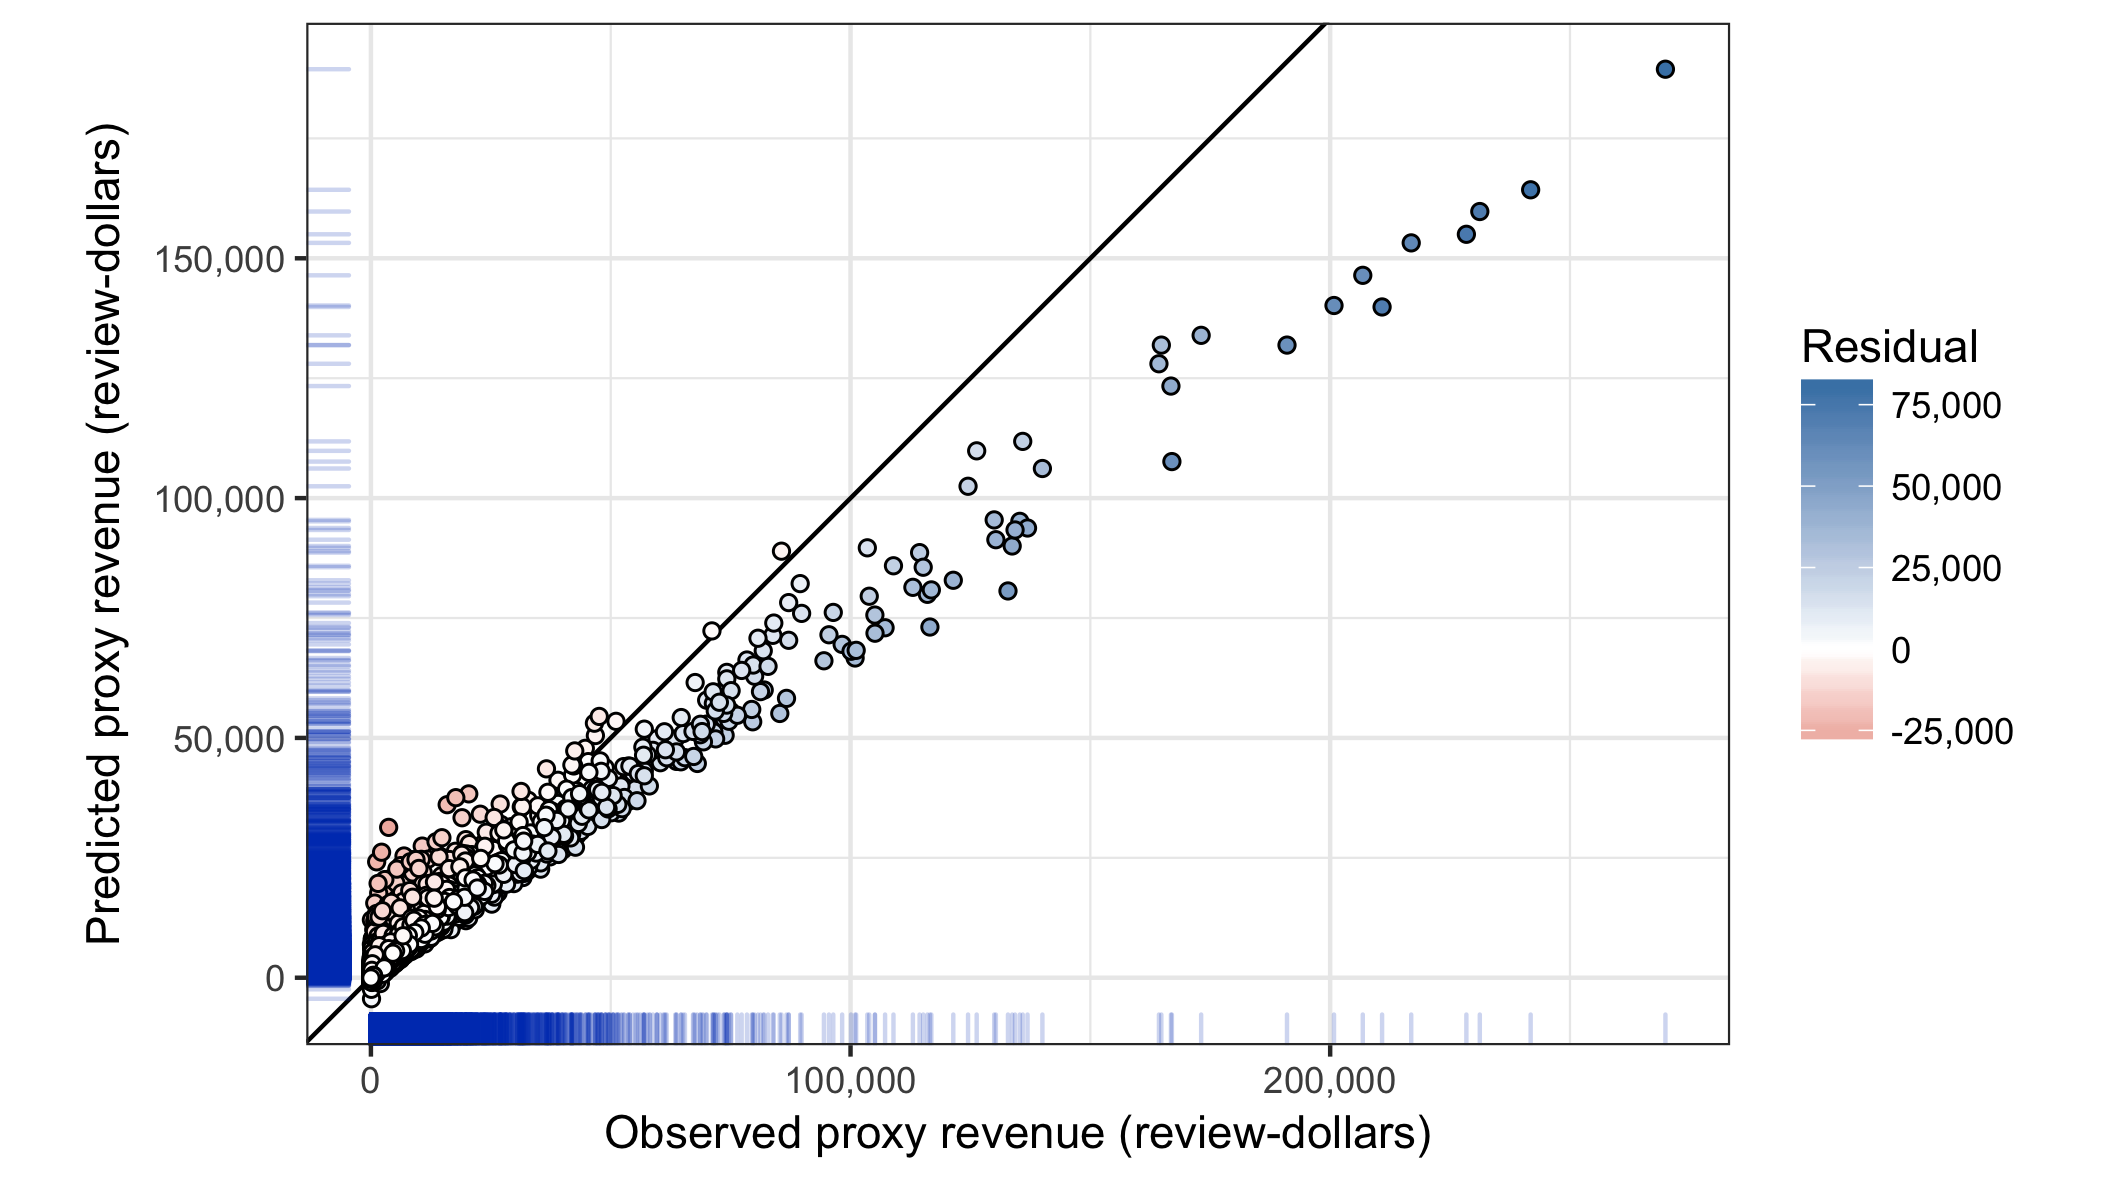
| Min. | 1st qu. | Median | Mean | 3rd Qu. | Max |
|---|---|---|---|---|---|
| 10 | 700 | 2,600 | 7,021 | 7,200 | 269,900 |
When trained on the full data set, the model achieves:
- RMSE of 4,601 review-dollars
- Mean absolute error of 2,043 review-dollars
- \(R^2\) of 0.91
Prediction quality across two levels
The model achieves 80% precision and 97% recall for restaurants with above-median proxy revenues.

Prediction quality across four levels
The model achieves 79% precision and 93% recall for restaurants with top-quartile proxy revenues.

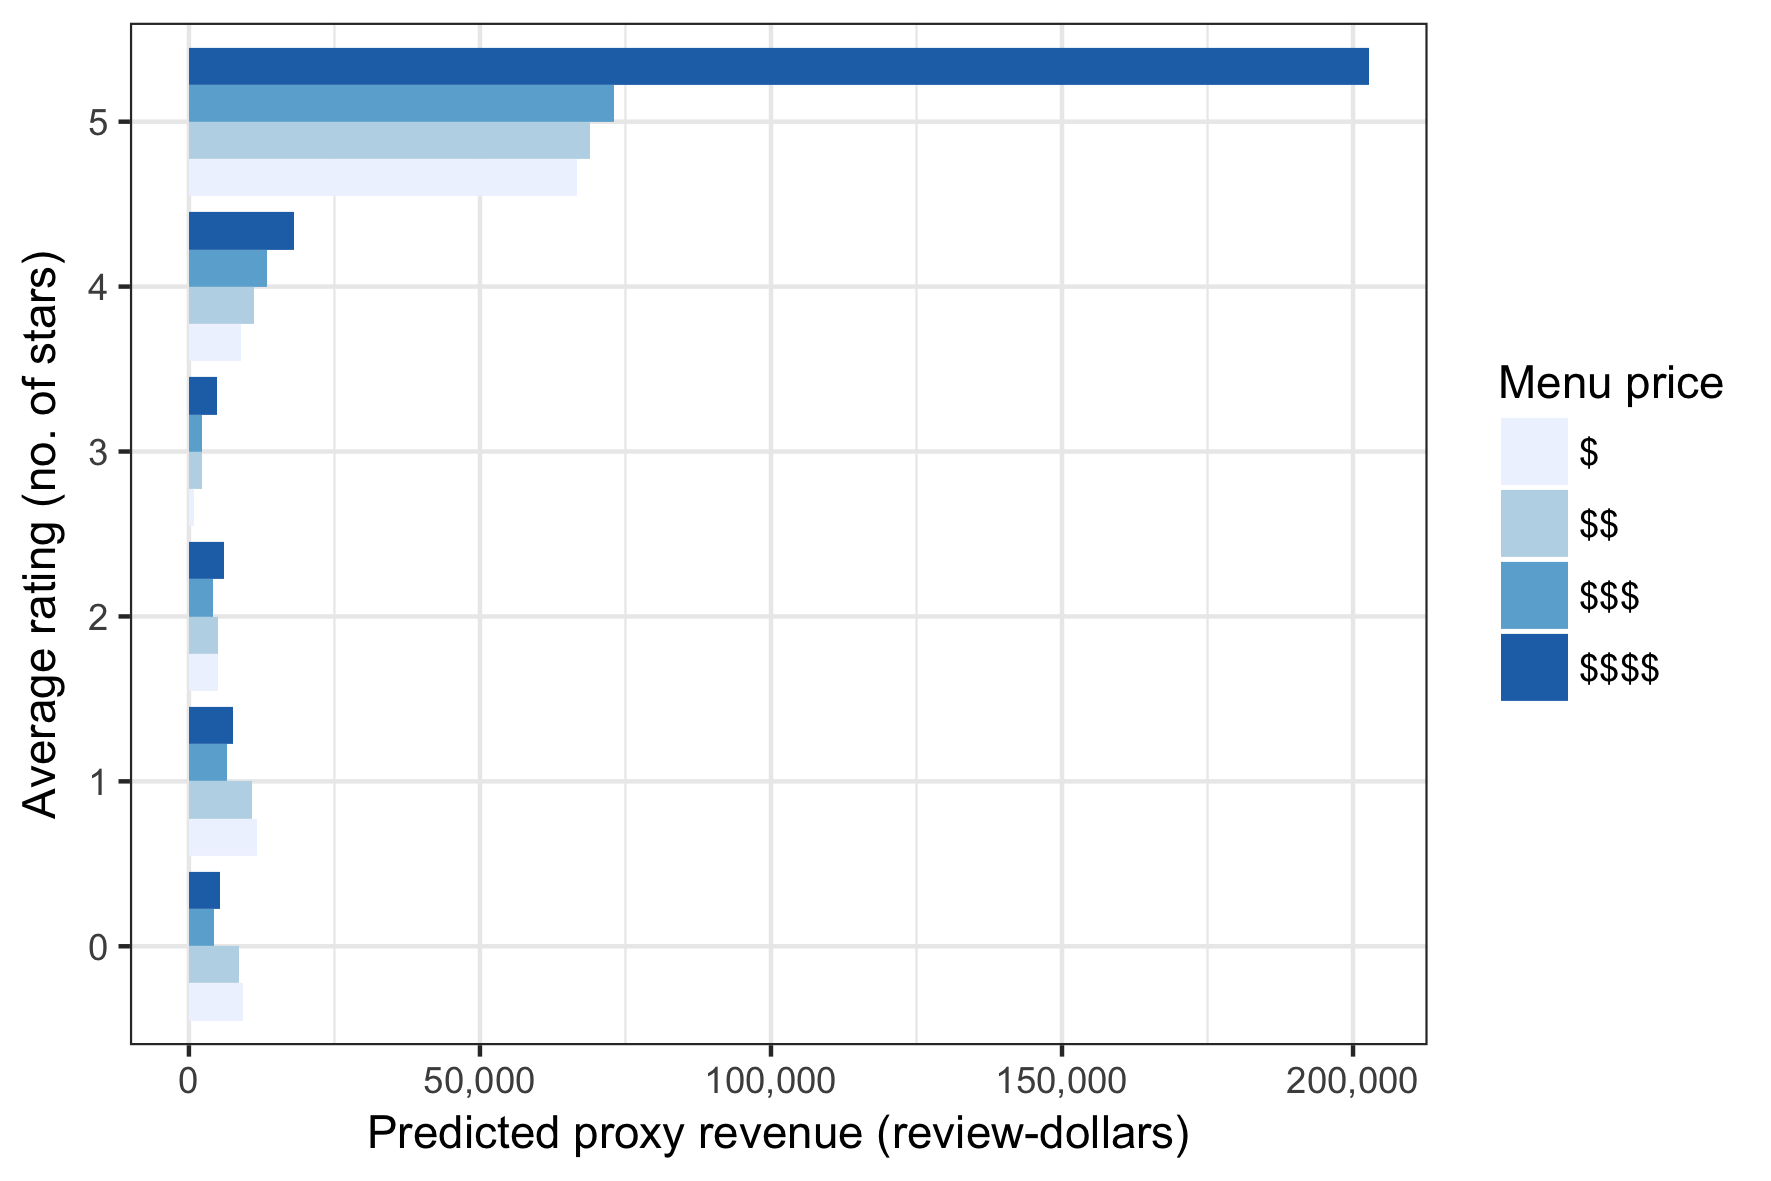
Dollar-value of a rating star
While a review with more stars suggests a superior dining experience, the restaurant revenue model suggests that the dollar-value of an additional review star becomes meaningful only after having already earned three stars.
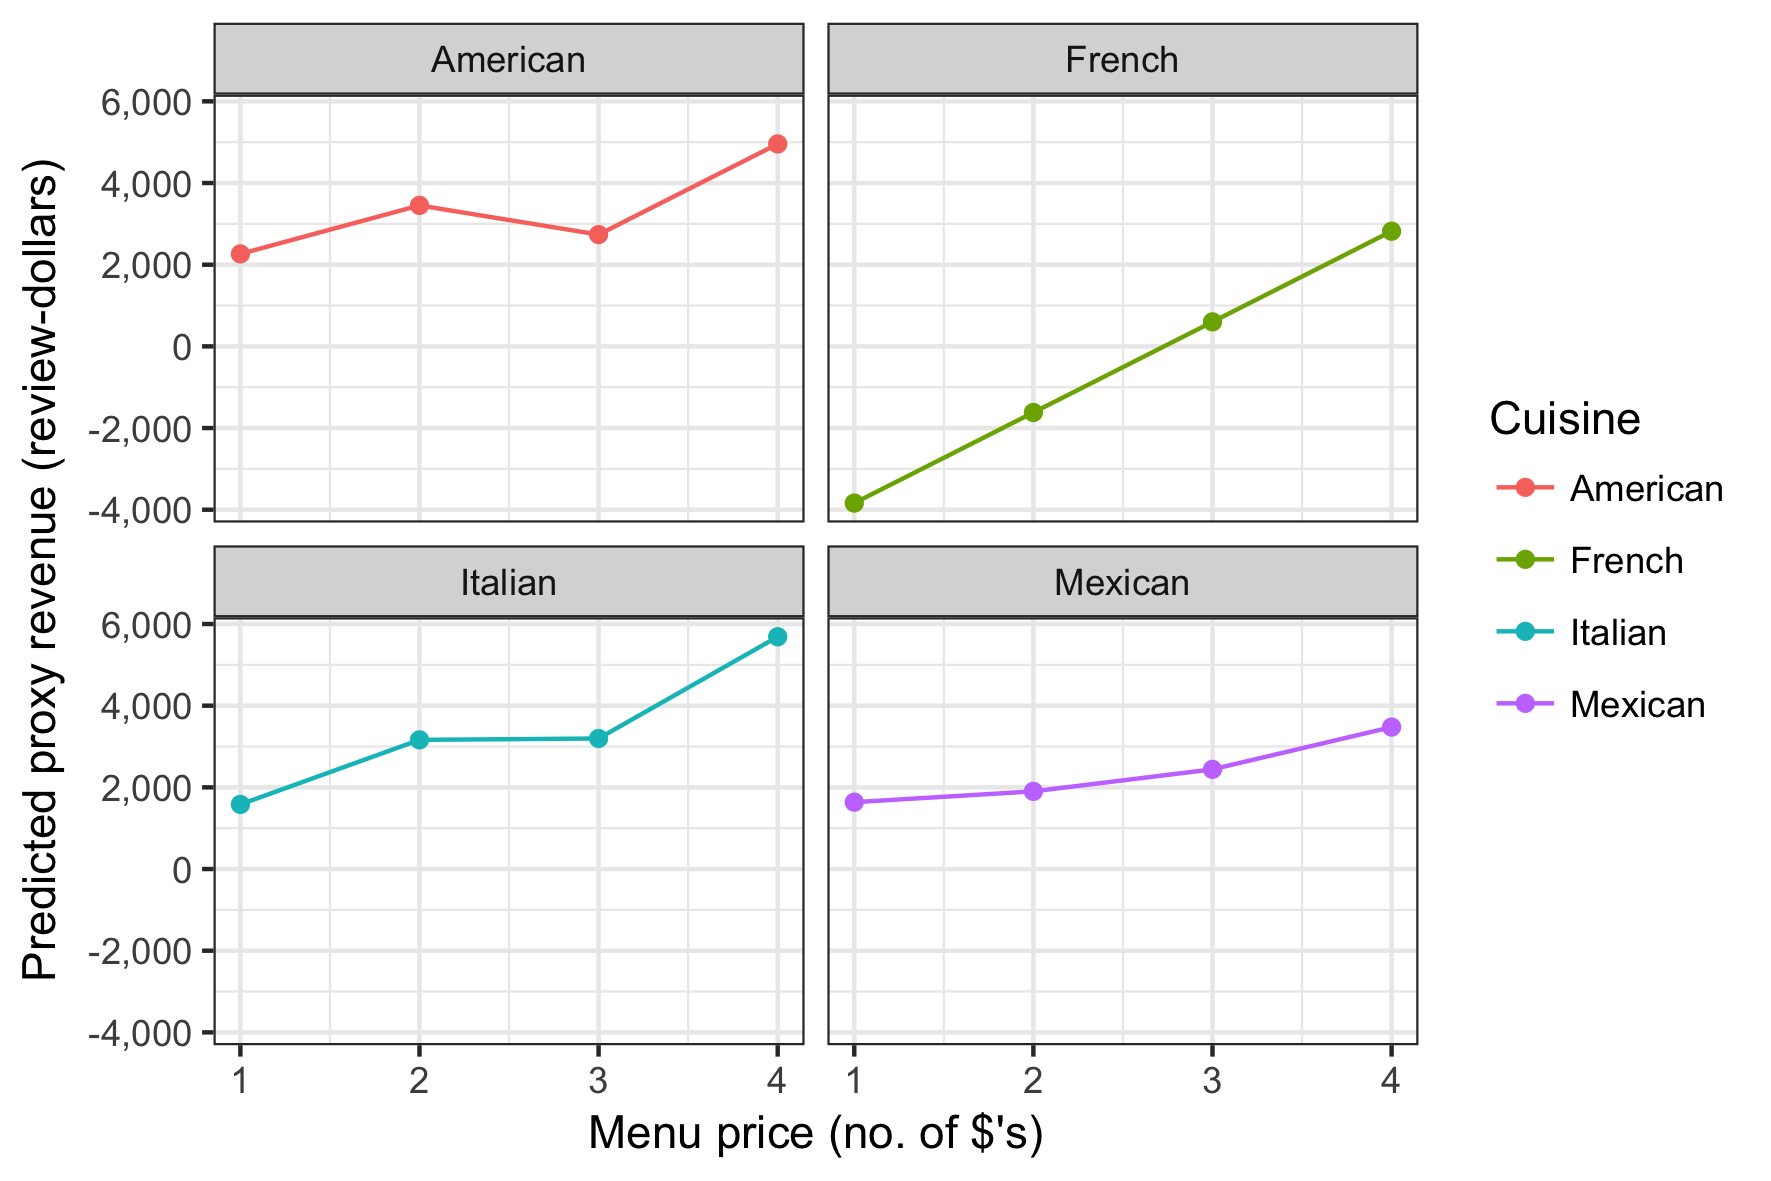
Pivoting on price
While sliding up the menu-price scale generally correlates with higher proxy revenues, the marginal impact of moving up a price tier varies considerably by cuisines served.
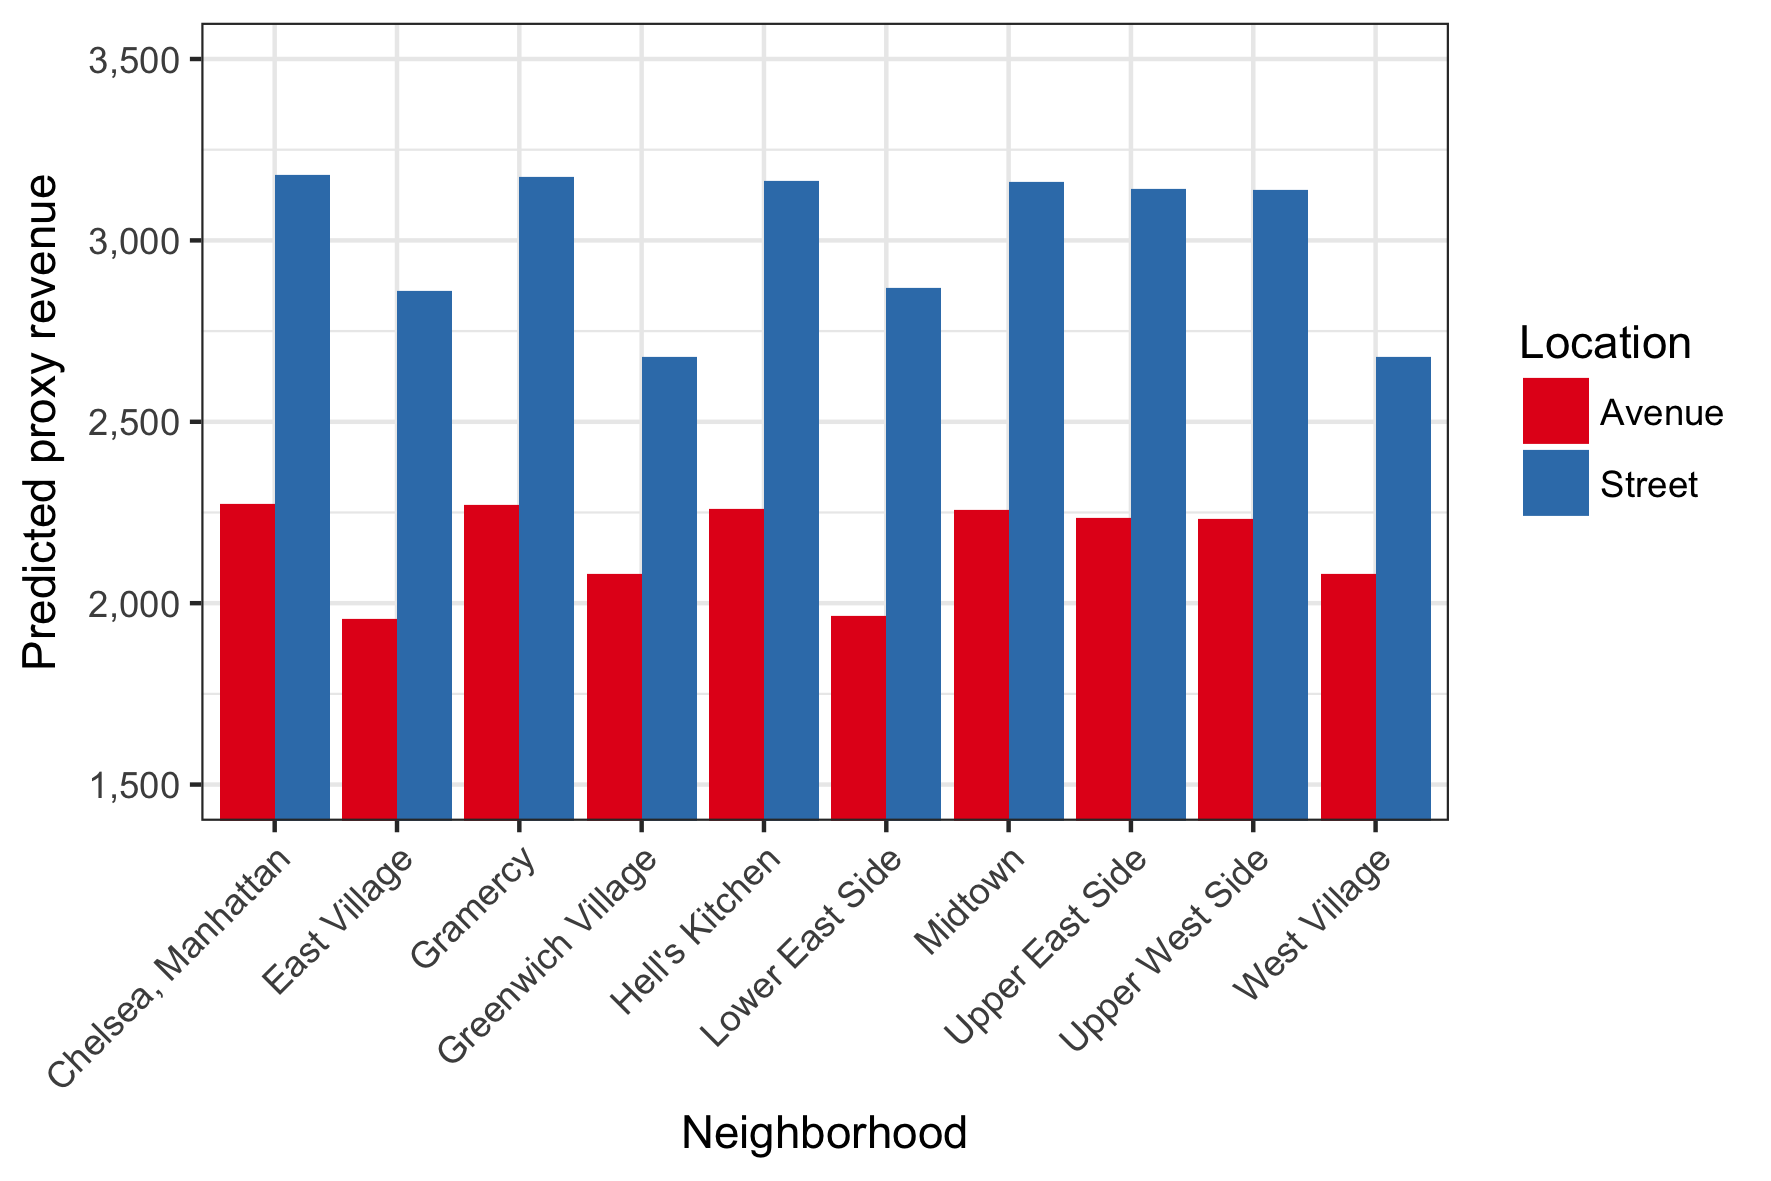
On- vs. off-avenue locations
On-avenue restaurant locations provide exposure to transit patterns that significantly differ from those of off-avenue locations. While avenues tend to be busier than streets, the model suggests that off-avenue locations could demand a premium in many neighborhoods.
Restaurant feature recommender
(prototype)
The recommender utility summarizes the output of a model that uses tensor-matrix factorization to decompose a three-dimensional array of average restaurant scores, indexed by cuisine, location, and menu price. This approach allows for both data compression and interpolation across missing values.
The model decomposes the original three-dimensional array into a small rank-3 tensor and three low-dimensional matrices. The restaurant score is a real number between 0 and 5 that is determined by the function \[ f(r, v; c) = r \left(1 - \frac{1}{cv + 1}\right), \] where \(r\) is the restaurant's average rating on a 0-to-5 scale, \(v\) is the number of reviews (or votes) a restaurant has received, and \(c\) is a parameter that we calibrate to allow restaurants with a median number of reviews to receive a score of \(f(r) = 0.5 r\).
In the table below, Score and Fit correspond
to the observed and estimated restaurant scores,
respectively. A higher Fit is better.